D27-8214-2 Rev 1
DAILY REPORT
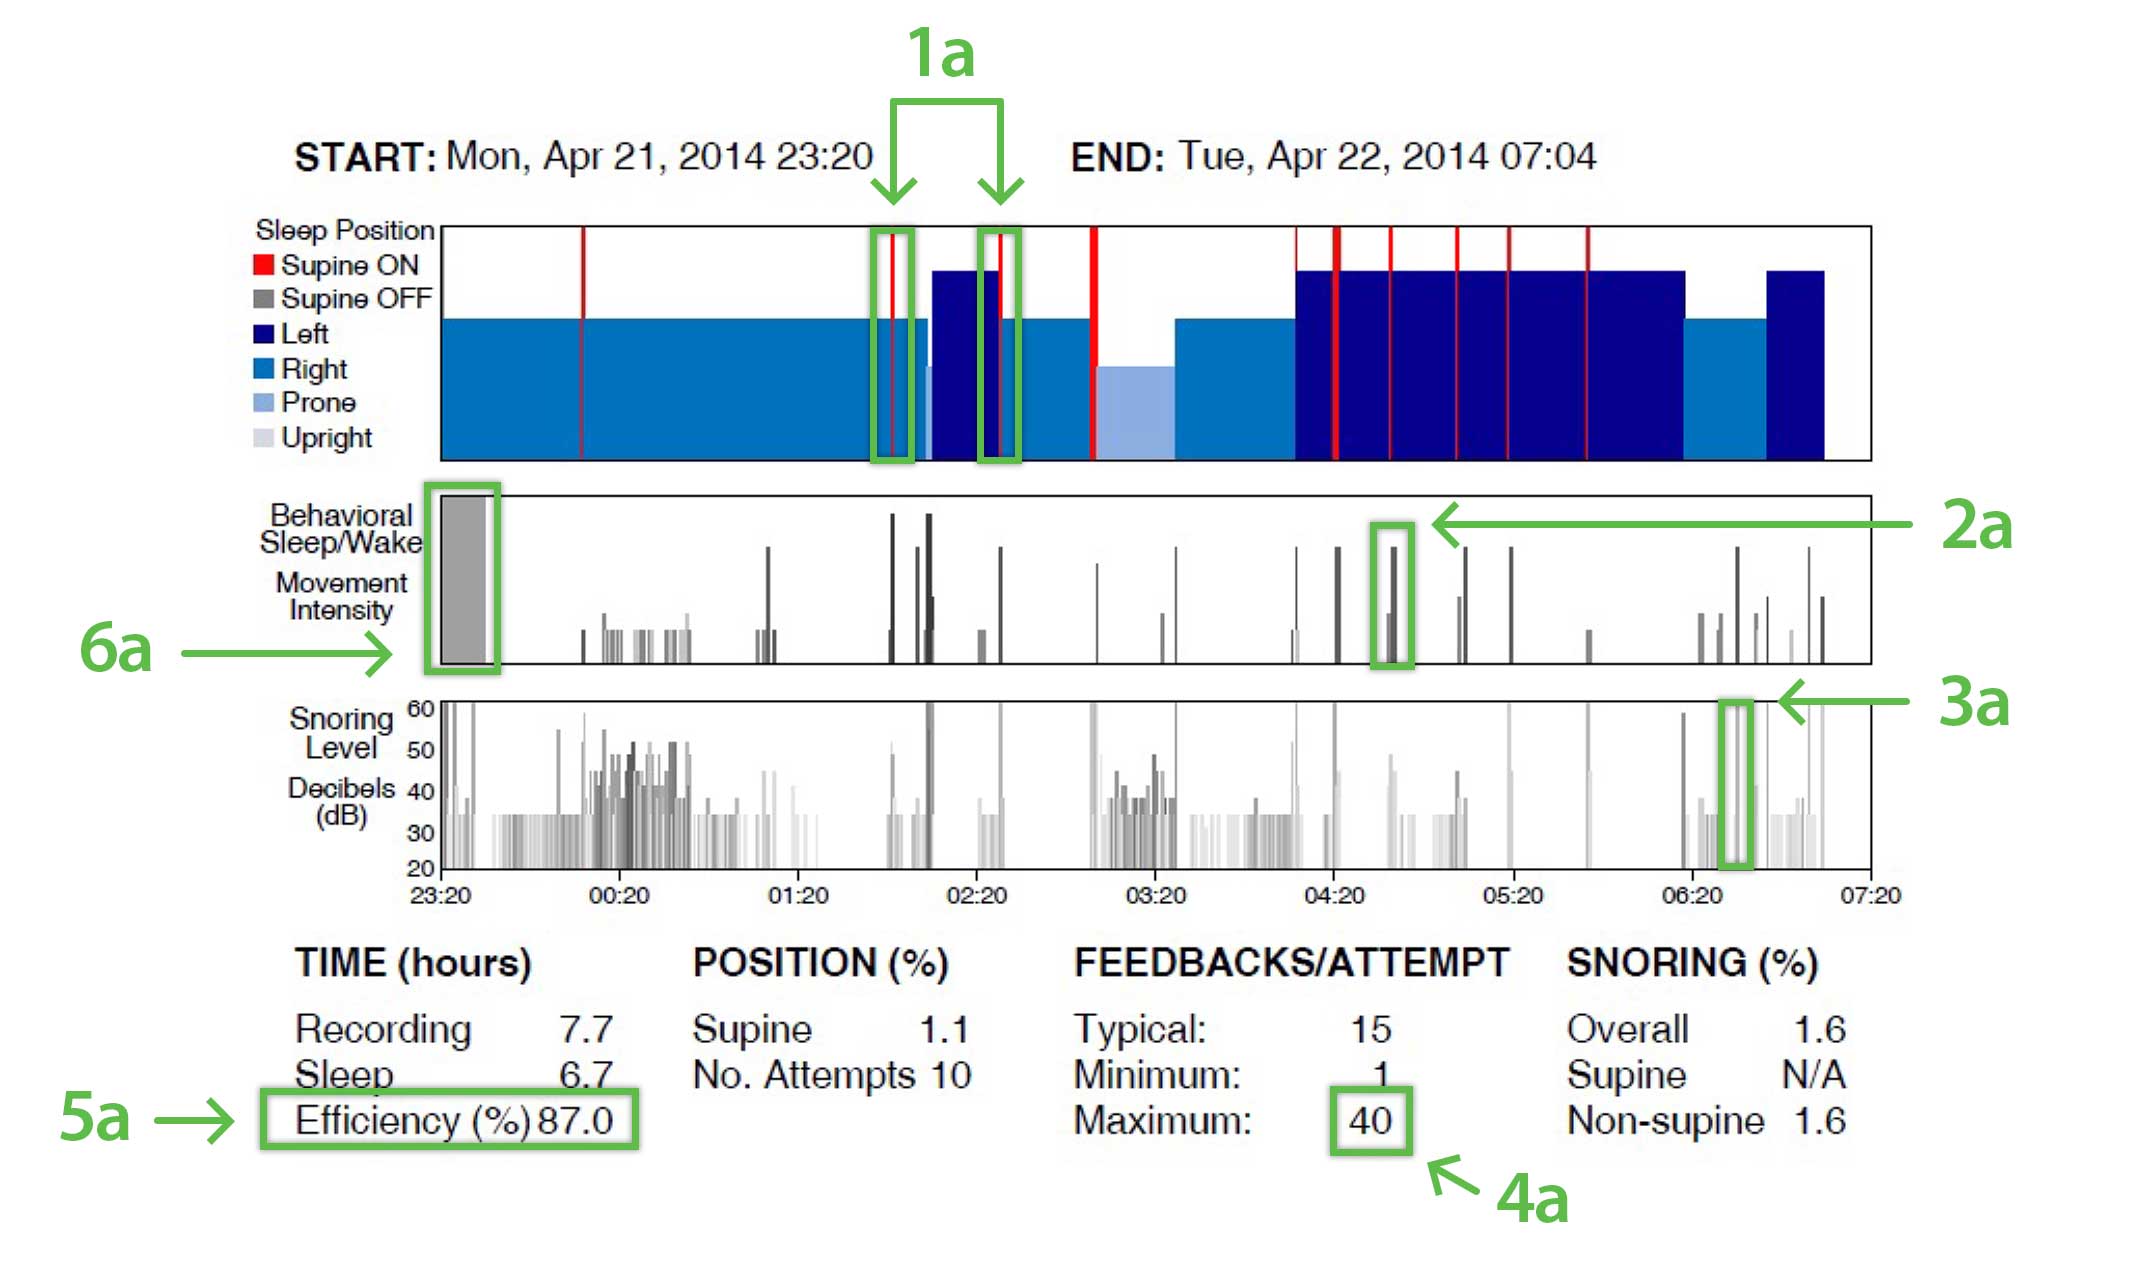
- The number of times you attempt to sleep on your back and how quickly you respond to therapy, shown by the number and thickness of red lines in the Sleep Position graph.
- Your sleep efficiency (how long you were awake after initially falling asleep). The intensity of the neck movement (used to determine an awakening) is presented with a combination of height and darkness of the line in the Behavioral Sleep/Wake graph. NOTE: If you are using the Chest Belt, you will not receive the Behavioral Sleep/Wake graph or the Sleep Time and Sleep Efficiency variables.
- The percentage of the night when loud snoring was detected, while you were asleep. The intensity of the snoring is presented using a combination of height and darkness of the line in the Snoring Level graph. NOTE: Due to the differing location of the microphone, the chest belt snoring data should not be compared to the neck strap snoring data.

| 1a ) Red lines identify supine attempts, i.e., times attempted back sleeping | 4a ) Feedback is delivered every two seconds so the slowest (maximum) positional response to feedback was 80-seconds. |
| 2a ) Intensity of awakening | 5a) Sleep time divided by Recording Time equals Sleep Efficiency (%Eff) |
| 3a ) One line represents snoring for each 30-second period. | 6a) The first 10-minutes always awake, even if you do fall asleep immediately |
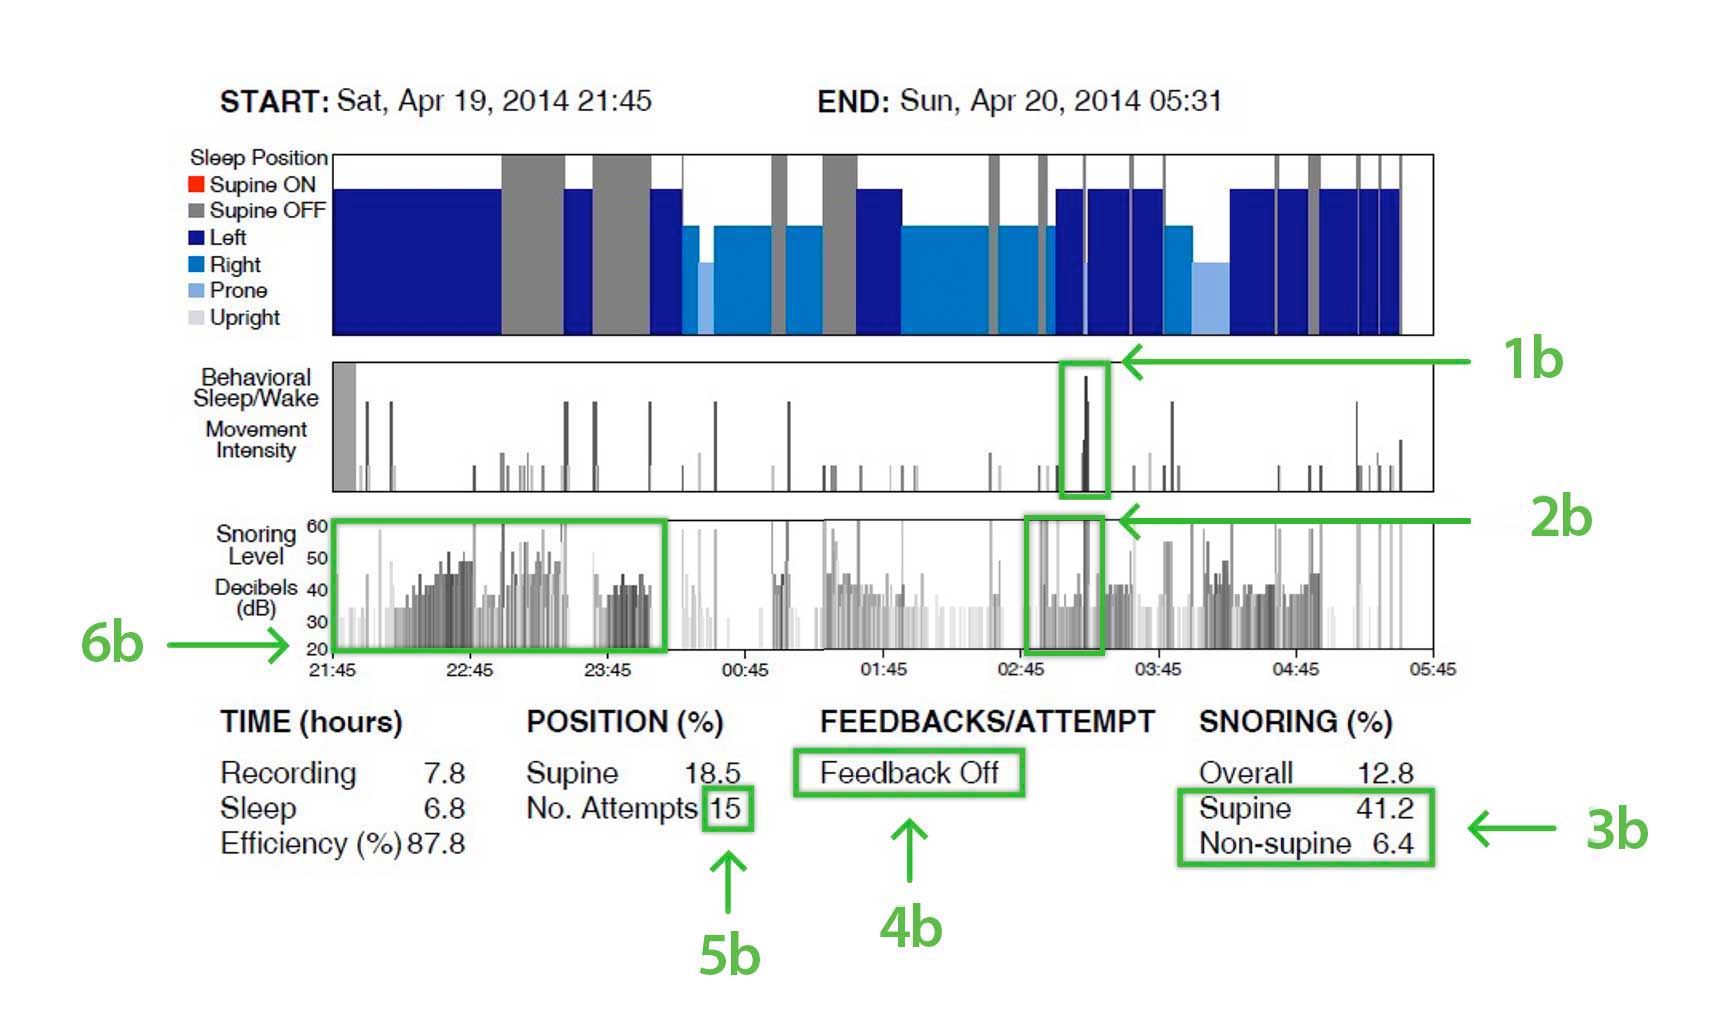
Sometimes a physician might set a device to Trial Mode, where the first night is set to Therapy-Off (example below) to obtain a baseline measure of sleep quality. It automatically switches to permanently provide Therapy-On (example above), while saving the first night baseline for comparison. This allows determination of:
- Your natural tendency toward wanting to sleep on your back, and whether this behavioral tendency changes from night to night.
- The effectiveness of treatment provided by other sleep apnea or snoring therapies when sleeping in all positions

| 1b) Taller, darker lines indicate greater intensity of movement during an awakening | 4b) The therapy-OFF (feedback-OFF) night is identified for this night’s information |
| 2b) Tall, dark lines indicate very loud, steady snoring | 5b) Number of supine attempts increased without feedback |
| 3b) The difference between supine and non-supine % time snoring suggests an ideal candidate for Night Shift therapy | 6b) It is common for snoring intensity to be greater during first half of the night. |
REPORT DEFINITIONS
| Report Name | Description |
|
Time (hours) |
|
| Recording | Number of hours that night the device was ON |
| Sleep | Number of hours the device was ON and detected sleep |
| Efficiency | Percentage of time the device was ON that you were asleep |
|
Position (%) |
|
| Supine | Percentage of sleep time you were ON your back (supine) |
| No. Attempts | Number of times (red lines) feedback was delivered |
|
Feedbacks / Attempt |
|
| Typical | Average number of feedback vibrations needed to move you off your back |
| Minimum | Least number of feedback vibrations needed to move you off your back |
| Maximum | Greatest number of feedback vibrations needed to move you off your back |
|
Snoring (%) |
|
| Overall | Percentage of sleep time snoring which would sound like loud talking |
| Supine | Percentage of supine sleep time snoring which would sound like loud talking |
| Non-supine | Percentage of non-supine sleep time snoring which would sound like loud talking |
REPORT IN EMAIL
The Night Shift App allows you to email a report. This report contains 3 sections. The first section shows the reports from above for the most recent 7 nights plus a baseline (if it exists). The next section contains the most recent 90-day Compliance Report. The final section displays the Yearly Report.
COMPLIANCE REPORT

Are you Using the Therapy Enough? The report shows the number of nights the Night Shift was worn and the average number of hours the device was used.

Is the Therapy Effective? The number of nights where you slept less than 10% of the night on your back and your average supine time is provided.

How many times does the device vibrate during the night? This report shows the number of supine attempts per day and the average number of supine attempts for the 30-day period.

How quickly are you responding to the vibrations? This report shows the maximum seconds needed to respond to the vibrations.

Did your upper airway health improve? Night Shift tracks the average percent of time you snored loudly, % of nights your loud snoring was greater than 10%, and whether your snoring is increasing over time (e.g., by trimester).

Did your Sleep Quality improve? Night Shift computes the monthly average for sleep efficiency and the number of nights your sleep efficiency is greater than 80%.

Was your Sleep Fragmented? Awakenings count the number of occurrences that a transition from sleep to wake occurred per hour of bed time.

YEARLY REPORT
This report is designed to demonstrate to your physician that you are routinely using the therapy, as well as help you monitor your own therapy.
The yearly report contains number of days of the month used and monthly averages of the hours used, Sleep Efficiency, Awakenings, WASO, Supine Time, Supine Attempts and Time Snoring above 50dB.

© 2023 Advanced Brain Monitoring, Inc.

